The goal of a clinical analysis is to identify, from millions of patient's variants, a few ones that may explain the disease. Once selected a few variants, they are classified according to a pathogenicity or clinical significance criteria.
For each selected variant, OpenCGA creates a reported clinical variant that mainly, consists of a list of reported events or clinical variant evidences. An And each reported event evidence classifies the variant according to it a tier, ACGM value, clinical significance, drug response, trait association and functional effect and more.
Clinical analysis classification
OpenCGA provides two types of clinical analysis depending on the outcome:
- Analysis that return a list of reported of clinical variants:
- Primary finding analysis
- Secondary finding analysis
- Analysis that return a clinical analysis interpretation.
An interpretation consists of two lists of clinical variants (one for primary findings, and one for secondary findings), a list of panels and the low-coverage regions for that panel genes. OpenCGA implements different interpretation :
Customizable analysis for both rare disease and cancer.- Interpretation analysis for rare diseases:
Clinical interpretation
- TEAM interpretation analysis
- TEAM interpretation analysis
- Interpretation analysis for cancer:
- Interpretation analysis based on
- GEL cancer tiering algorithm.
- Interpretation analysis for rare diseases:
| Anchor | ||||
|---|---|---|---|---|
|
Tiering interpretation analysis based on GEL tiering algorithm
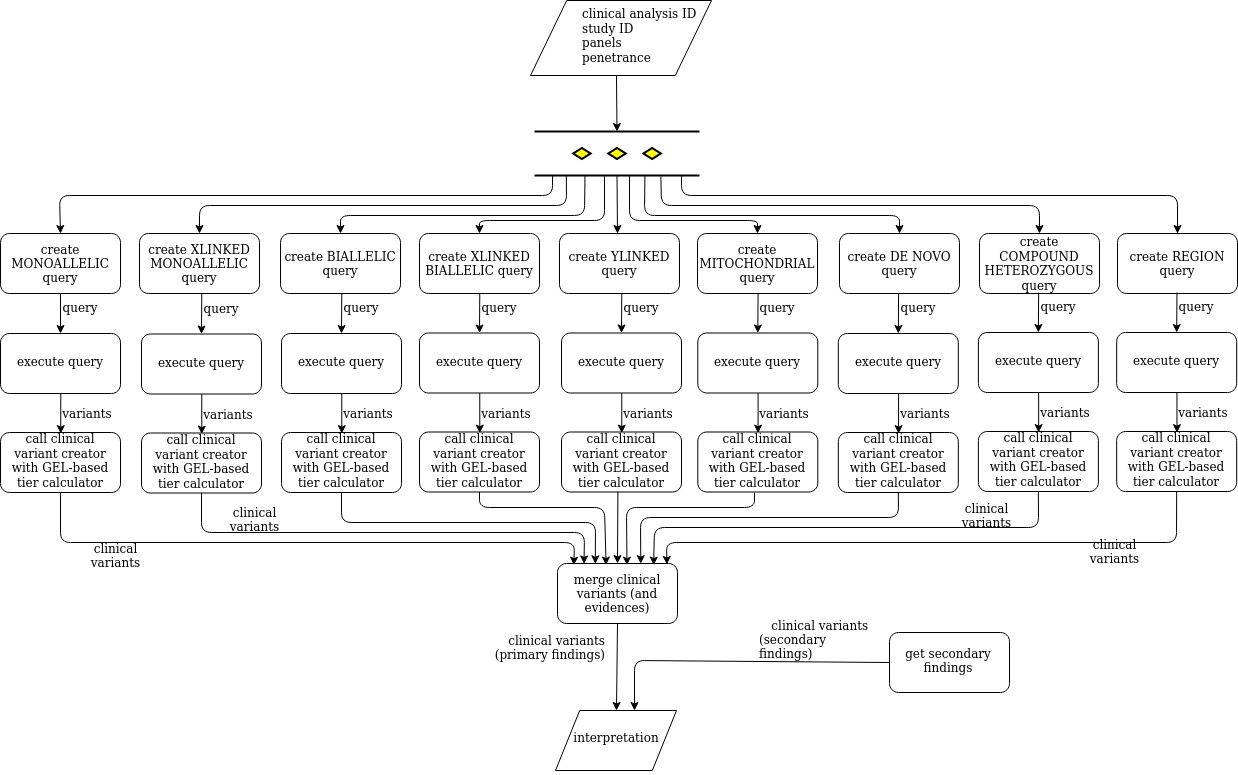
CancerThe tiering interpretation analysis creates and executes, in parallel (multithreaded execution), a variant query for each mode of inheritance (family segregation), those queries filter by a set of consequence types, protein coding biotype and population frequencies and calls the clinical variant creator in order to create clinical variants. In addition, it executes a secondary findings analysis. The tiering interpretation analysis returns a clinical analysis interpretation.
The following diagram shows how the tiering interpretation analysis:
| Anchor | ||||
|---|---|---|---|---|
|
Zetta interpretation analysis
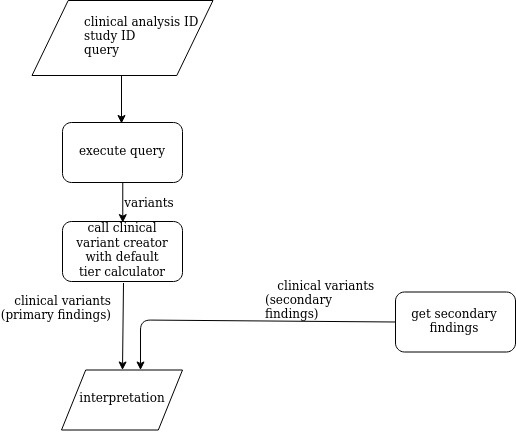
The Zetta interpretation analysis executes an user-defined query in order to retrieve the variants that are processed by the clinical variant creator in order to create clinical variants. In addition, it executes a secondary findings analysis an. The Zetta interpretation analysis returns a clinical analysis interpretation.
The following diagram shows how the Zetta interpretation analysis:
Anchor clinicalvariantcreator clinicalvariantcreator
| clinicalvariantcreator | |
| clinicalvariantcreator |
Clinical variant creator
The clinical variant creator creates clinical variant(s) from the input variant(s) according to certain parameters and configuration options. A clinical variant evidence is created for each combination of mode of inheritance, panel and trascript. See diagram below: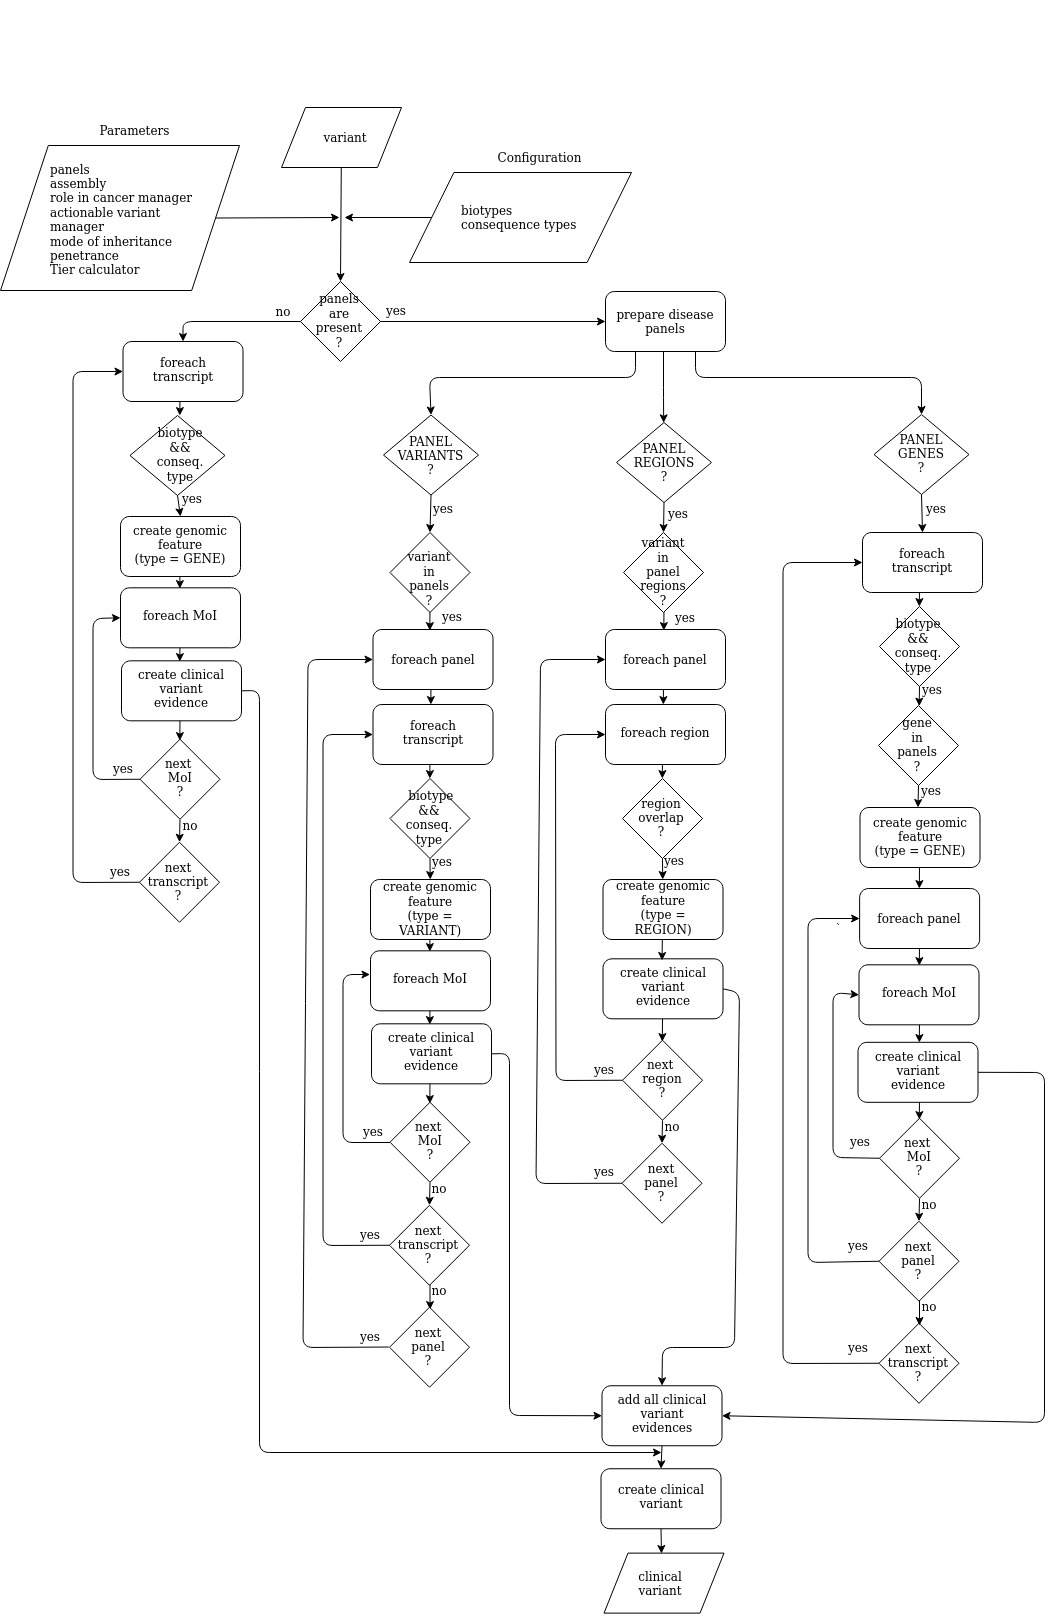
Tier calculator
To assign the tier value of a selected variant is crucial in clinical analysis. OpenCGA considers three values:
- Tier 1, variants with strong clinical significance
- Tier 2, variants with potential clinical significance
- Tier 3, other findings
OpenCGA implements two algorithms to assign tier values:
- Default tier calculator
- GEL-based tier calculator
| Anchor | ||||
|---|---|---|---|---|
|
Default tier calculator
Default tier calculator sets the tier score for each clinical variant evidence taking into account:
- the genomic feature type (VARIANT, GENE or REGION)
- the mode of inheritance (MoI) and
- the overlap percentage.
The default tier calculator is used by the primary findings, secondary findings, Zetta interpretation and TEAM-based interpretation analysis.
The following diagram shows how the default tier calculator assigns a tier value:
| Anchor | ||||
|---|---|---|---|---|
|
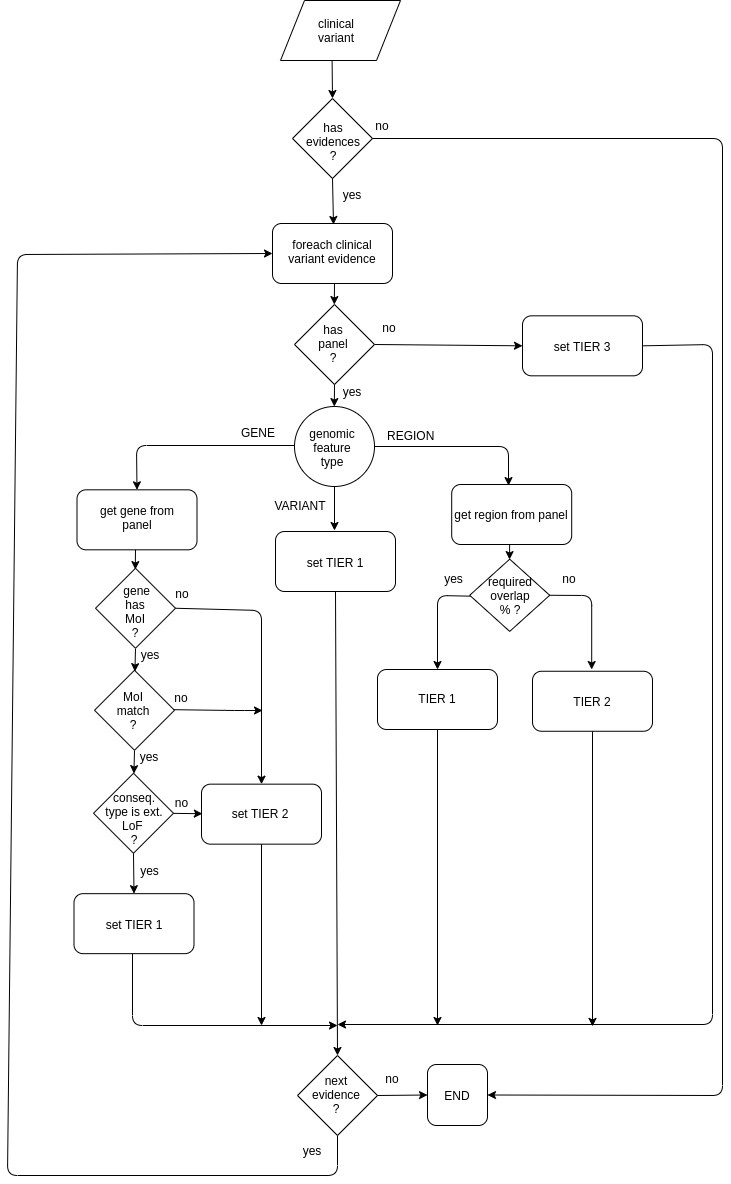
GEL-based tier calculator sets the tier value for each reported event of a given reported variant taking into account:
- the genomic feature type (GENE or REGION),
- the mode of inheritance (MoI) and
- the overlap percentage.
The GEL-based tier calculator is used by the interpretation analysis based on GEL
cancer tiering algorithm.algorithms.
The following diagram shows how the GEL-based tier calculator assigns a tier value:
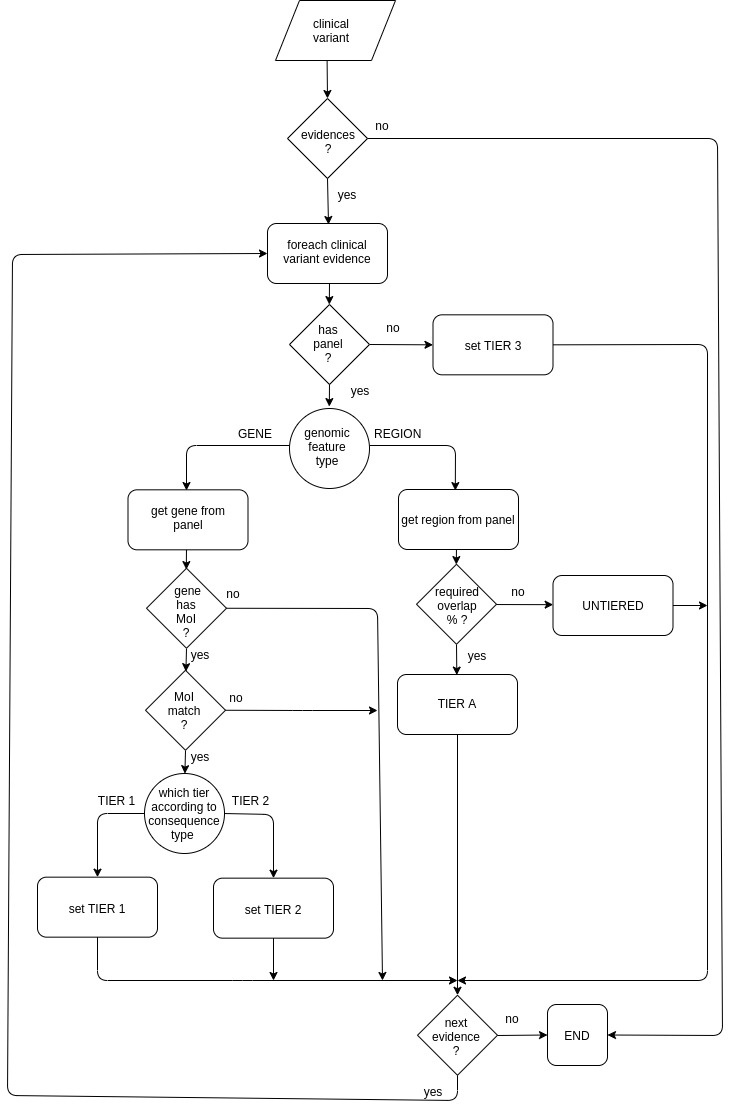
Table of Contents:
| Table of Contents | ||
|---|---|---|
|
Useful Links