Versions Compared
Key
- This line was added.
- This line was removed.
- Formatting was changed.
One of the goals of The 100,000 Genomes Project from Genomics England is to enable new medical research. Researchers will study how best to use genomics in healthcare and how best to interpret the data to help patients. The causes, diagnosis and treatment of disease will also be investigated. This is currently the largest national sequencing project of its kind in the world.
To achieve this goal Genomics England set up a Research environment for the researchers and clinicians, and we installed . OpenCGA, CellBase and IVA from OpenCB were installed as data platform. We have loaded 64,078 whole genomes in OpenCGA, in total more than 1 billion unique variants have been were indexed in the OpenCGA Variant Storage, and all the metadata and clinical data for samples and patients have been were loaded in OpenCGA Catalog. OpenCGA was able to index about 6,000 samples a day, variant annotation and cohort stats run in about 2 more days, in total all for the all the data run in less than a week. All data was loaded, annotated and stats calculated in less than 2 weeks. Variants Genomics variants were annotated using CellBase and the IVA front-end was installed to analyse and visualise the data. Here In this case study you can find a full report of about the loading and analysis of the 64,078 genomes.
Genomic and Clinical Data
The variants and clinical data Clinical data and genomic variants of 64,078 genomes been were loaded and indexed in OpenCGA. In total they represent we loaded more than 30,000 VCF compressed files compressed accounting for about 40TB of disk space. Data is was divided in four different datasets depending on the genome assembly (GRCh37 or GRCh38) and the type of study (germline or somatic), this data has been organised in OpenCGA in three different Projects and four Studies:
| Project | Study ID and Name | Samples | VCF Files | VCF File Type | Samples/File | Variants |
|---|---|---|---|---|---|---|
| GRCh37 Germline | RD37 Rare Disease GRCh37 | 12,142 | 5,329 | Multi sample | 2.28 | 298,763,059 |
| GRCh38 Germline | RD38 Rare Disease GRCh38 | 33,180 | 16,591 | Multi sample | 2.00 | 437,740,498 |
CG38 Cancer Germline GRCh38 | 9,167 | 9,167 | Single sample | 1.00 | 286,136,051 | |
| GRCh38 Somatic | CS38 Cancer Somatic GRCh38 | 9,589 | 9,589 | Somatic | 1.00 | 398,402,166 |
| Total | 64,078 | 40,676 | 1,421,041,774 | |||
OpenCGA Catalog stores all the metadata and clinical data of files, samples, individuals and cohorts. Rare Disease studies also include pedigree metadata by defining families. Also, a Clinical Analysis has been were defined for each family. Several Variable Sets have been defined to store GEL custom data for all these entities.
Platform
For the Research environment we have used OpenCGA v1.4 using the new Hadoop Variant Storage that use Apache HBase as back-end because of the huge amount of data and analysis needed. We have also used CellBase v4.6 for the variant annotation. Finally we set up a IVA v1.0 web-based variant analysis tool.
The Hadoop cluster consists of about 30 nodes running Hortonworks HDP 2.6.5 (which comes with HBase 1.1.2) and a LSF queue for loading all the VCF files, see this table for more detail:
| Node | Nodes | Cores | Memory (GB) | Storage (TB) |
|---|---|---|---|---|
| Hadoop Master | 5 | 28 | 216 | 7.2 (6x1.2) |
| Hadoop Worker | 30 | 28 | 216 | 7.2 (6x1.2) |
| LSF Loading Queue | 10 | 12 | 364 | Isilon storage |
Genomic Data Load
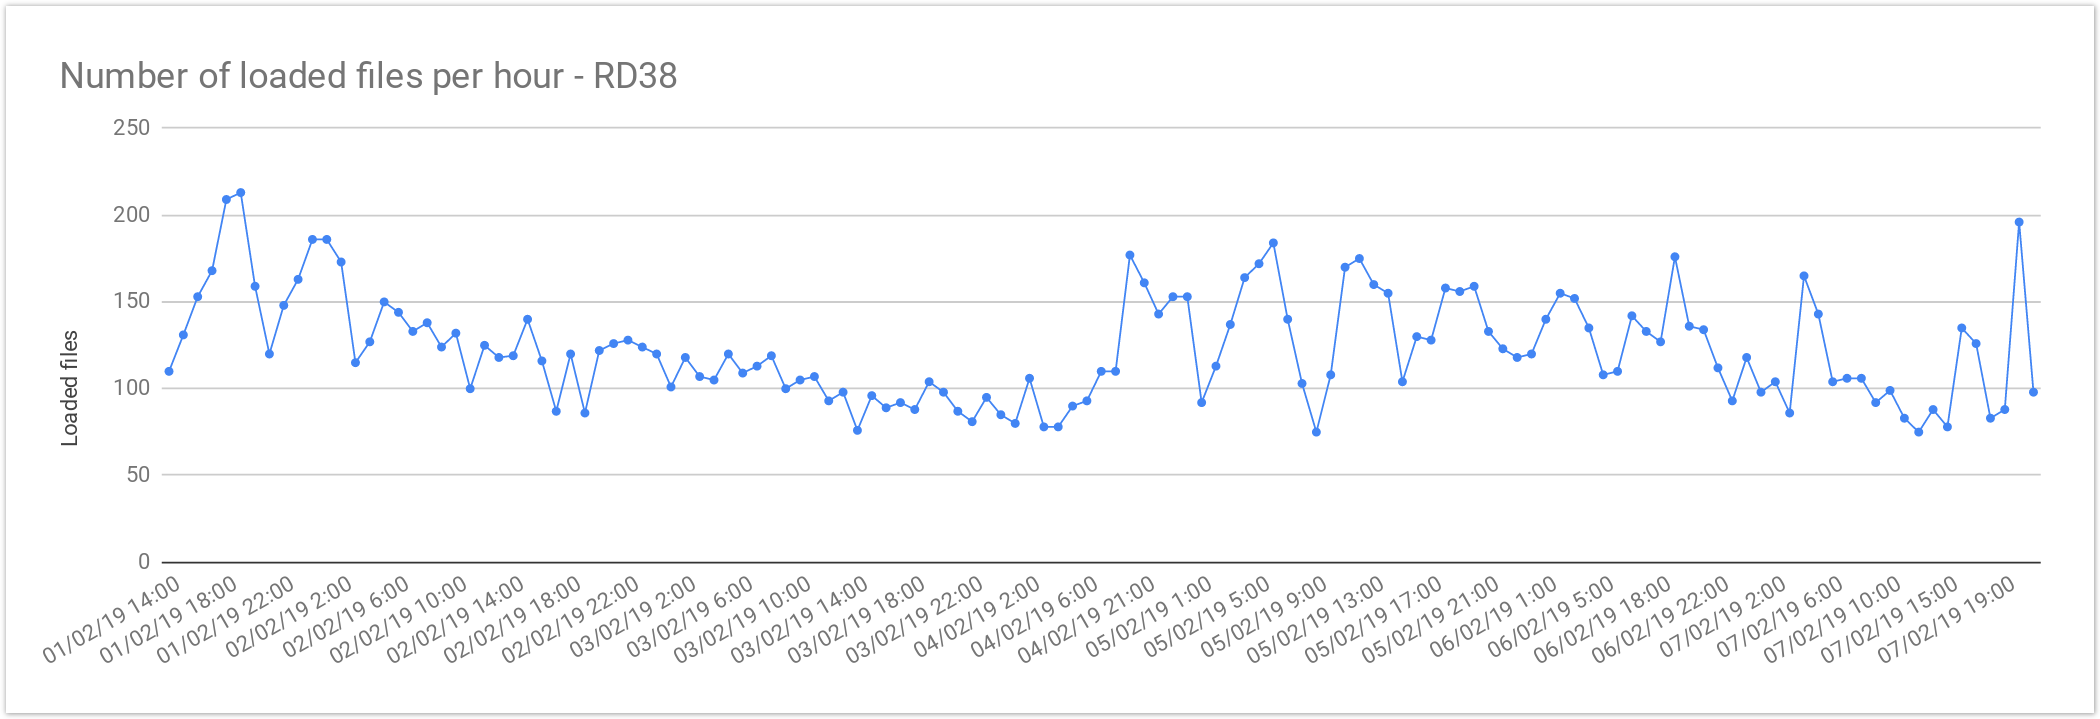
In order to improve the loading performance, we set up a small LSF queue of ten computing nodes. This configuration allows allowed us to load multiple files at the same time. We configured LSF to load up to 6 VCF files per node resulting in 60 files being loaded in HBase in parallel without any incidence, by doing this we observed a 50x in loading throughput. This resulted in an average of 125 VCF files loaded per hour in studies RD37 and RD38, which is about 2 files per minute. In the study CG38 the performance was 240 VCF files per hour or about 4 files per minute.
Rare Disease Loading Performance
The files from Rare Disease studies (RD38 & RD37) contain 2 samples per file on average. This results in larger files, increasing the loading time , compared with single-sample files. As mentioned above the loading performance was about 125 genomes files per hour or 3,000 files per day. In terms of number of samples it is about 250 samples per hour or 6,000 samples a day.
The loading performance always depend on the number of variants and concurrent files being loaded, the performance was quite stable during the load and performance degradation was observed as can be seen here:

| Concurrent files loaded | 60 |
|---|---|
| Average files loaded per hour | 125.72 |
| Load time per file | 00:28:38 |
Saturation Study
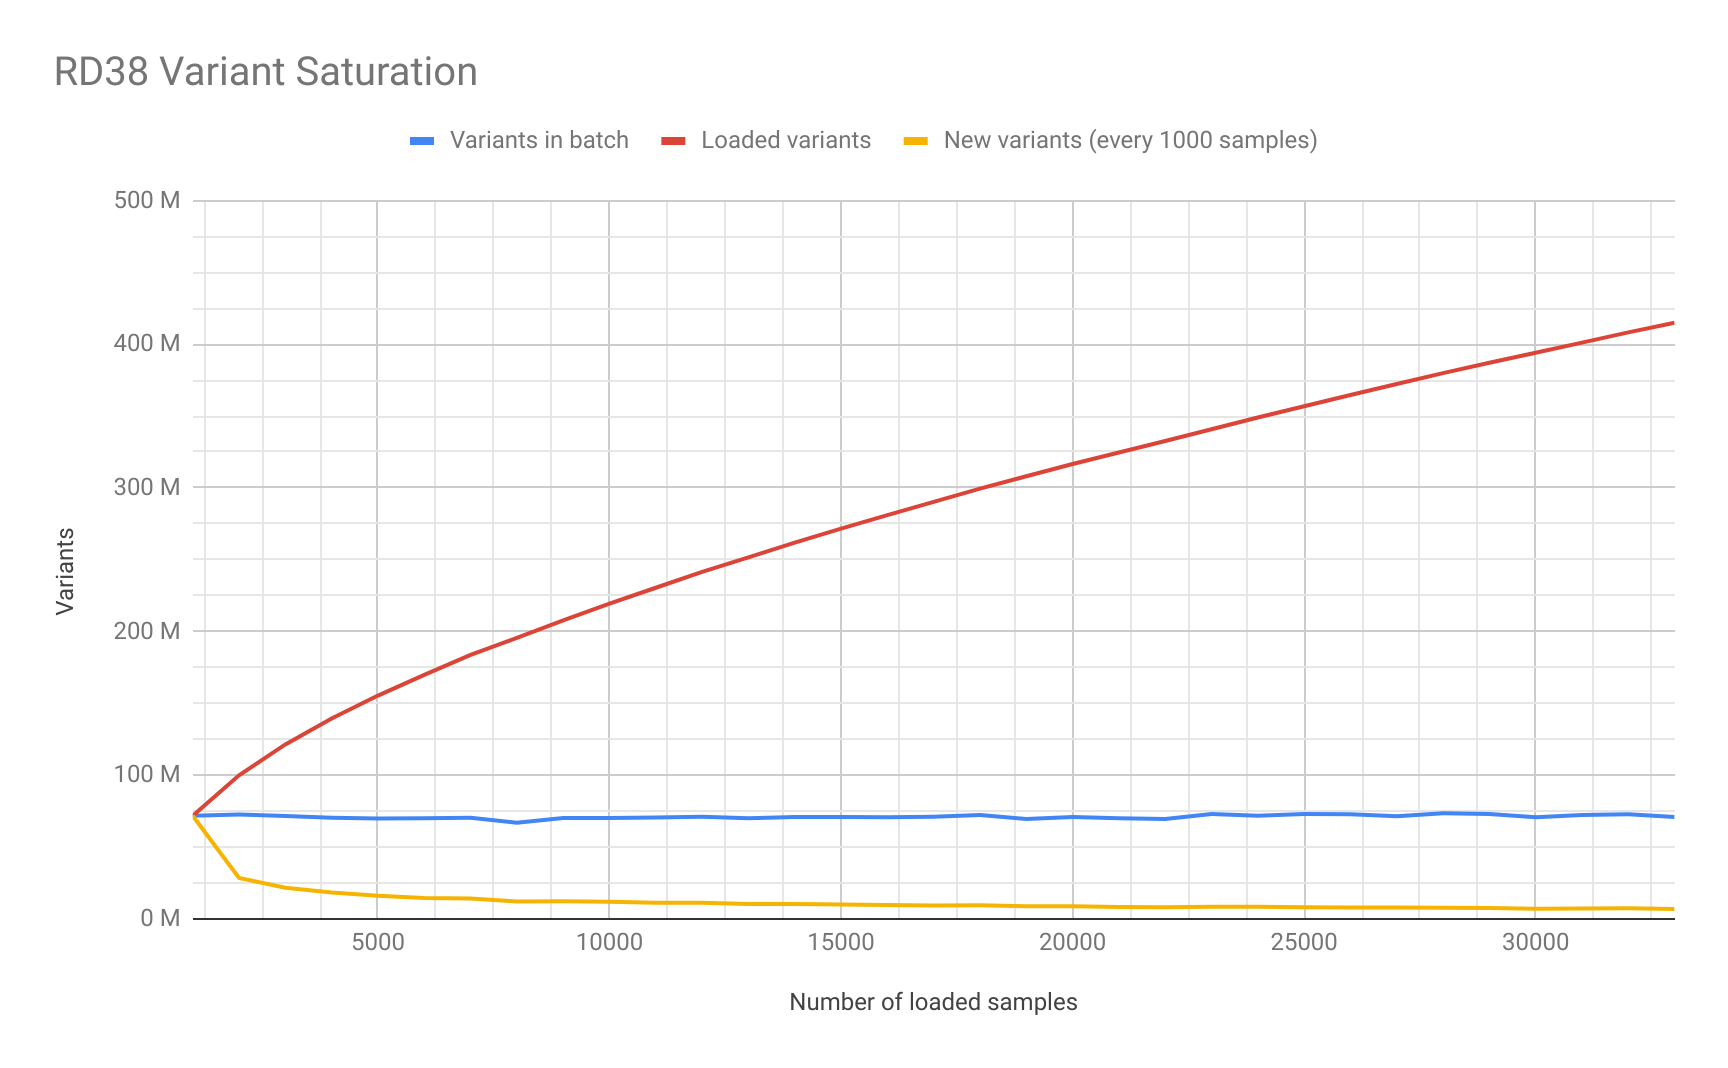
As part of the data loading process we decided to study the number of unique variants added in each batch of 1,000 500 samples. We generated this saturation plot for RD38:

Cancer Loading Performance
The files from Cancer Germline studies (CG38) contain one sample per file. Compared with the Rare Disease, these files are smaller in size, therefore, as expected the file load is was almost 2x faster. As mentioned above, the loading performance was about 240 genomes per hour or 5,800 files per day. In terms of number of samples it is about 5,800 samples a day, which is consistent with Rare Disease studiesperformance.

| Concurrent files loaded | 60 |
|---|---|
| Average files loaded per hour | 242.05 |
| Load time per file | 00:14:52 |
Analysis Benchmark
In this section we will outline you can find information about the performance of some main variant storage operations and most common queries and clinical analysis. Please, for data loading performance see information go to section Genomic Data Load above.
Variant Storage Operations
Variant Storage operations take care of leaving preparing the data ready for the executing queries and analysis. There are two main operations to consider: Variant Annotation and Cohort Stats Calculation.
Variant Annotation
This process operation uses theCellBase server to generate a Variant Annotation for annotate each unique variant in the database. This annotation is then , this annotation include consequence types, population frequencies, conservation scores clinical info, ... and will be typically used for filtering and analysis. The annotation throughput is 3.5M variants per hour. The process of annotating of the whole dataset took 17 days.Variant annotation of the 585 million unique variants of project GRCh38 Germline took about 3 days, about 200 million variants were annotated per day.
Cohort Stats Calculation
Cohort stats can be Stats are used for filtering variants in a similar way as the population frequencies. A set of cohorts where were defined in each study.
- ALL with all samples in the study
- PARENTS with all parents in the study (only for Rare Disease studies)
- UNAFF_PARENTS with all unaffected parents in the study (only for Rare Disease studies)
Precompute stats Pre-computing stats for different cohort and ten of thousands of samples is a lightning fast light operation that can run in less than 2 hours for each study, depending on the number of cohorts and variants.
Query and Aggregation Stats
These queries are are only filtering by variant annotation and cohort stats. These queries only include aggregated data, not returning sample genotypes.
| Filter | Results | Total Results | Time |
|---|---|---|---|
| consequence type = LoF + missense_variant | 10 | 3704626 | 0.189s |
consequence type = LoF + missense_variant biotype = protein_coding | 10 | 3576472 | 0.260s |
panel with 200 genes | 10 | 3882902 | 0.299s |
Clinical Analysis
Clinical queries, or sample queries, enforces queries to return variants of a specific set of samples. These queries can use all the filters from the general queries. The result will include a ReportedEvent for each variant, which determines possible conditions associated to the variant.
| Filter | Results | Total Results | Time |
|---|---|---|---|
Segregation mode = biallelic filter = PASS | 10 | 211787 | 0.420s |
Segregation mode = biallelic filter = PASS | 2000 | 211787 | 1.079s |
De novo variants filter = PASS consequence type = LoF + missense_variant | 24 | 24 | 0.680s |
| Compound Heterozygous filter = PASS biotype = protein_coding consequence type = LoF + missense_variant | 717 | 717 | 10.995s |
User Interfaces
IVA
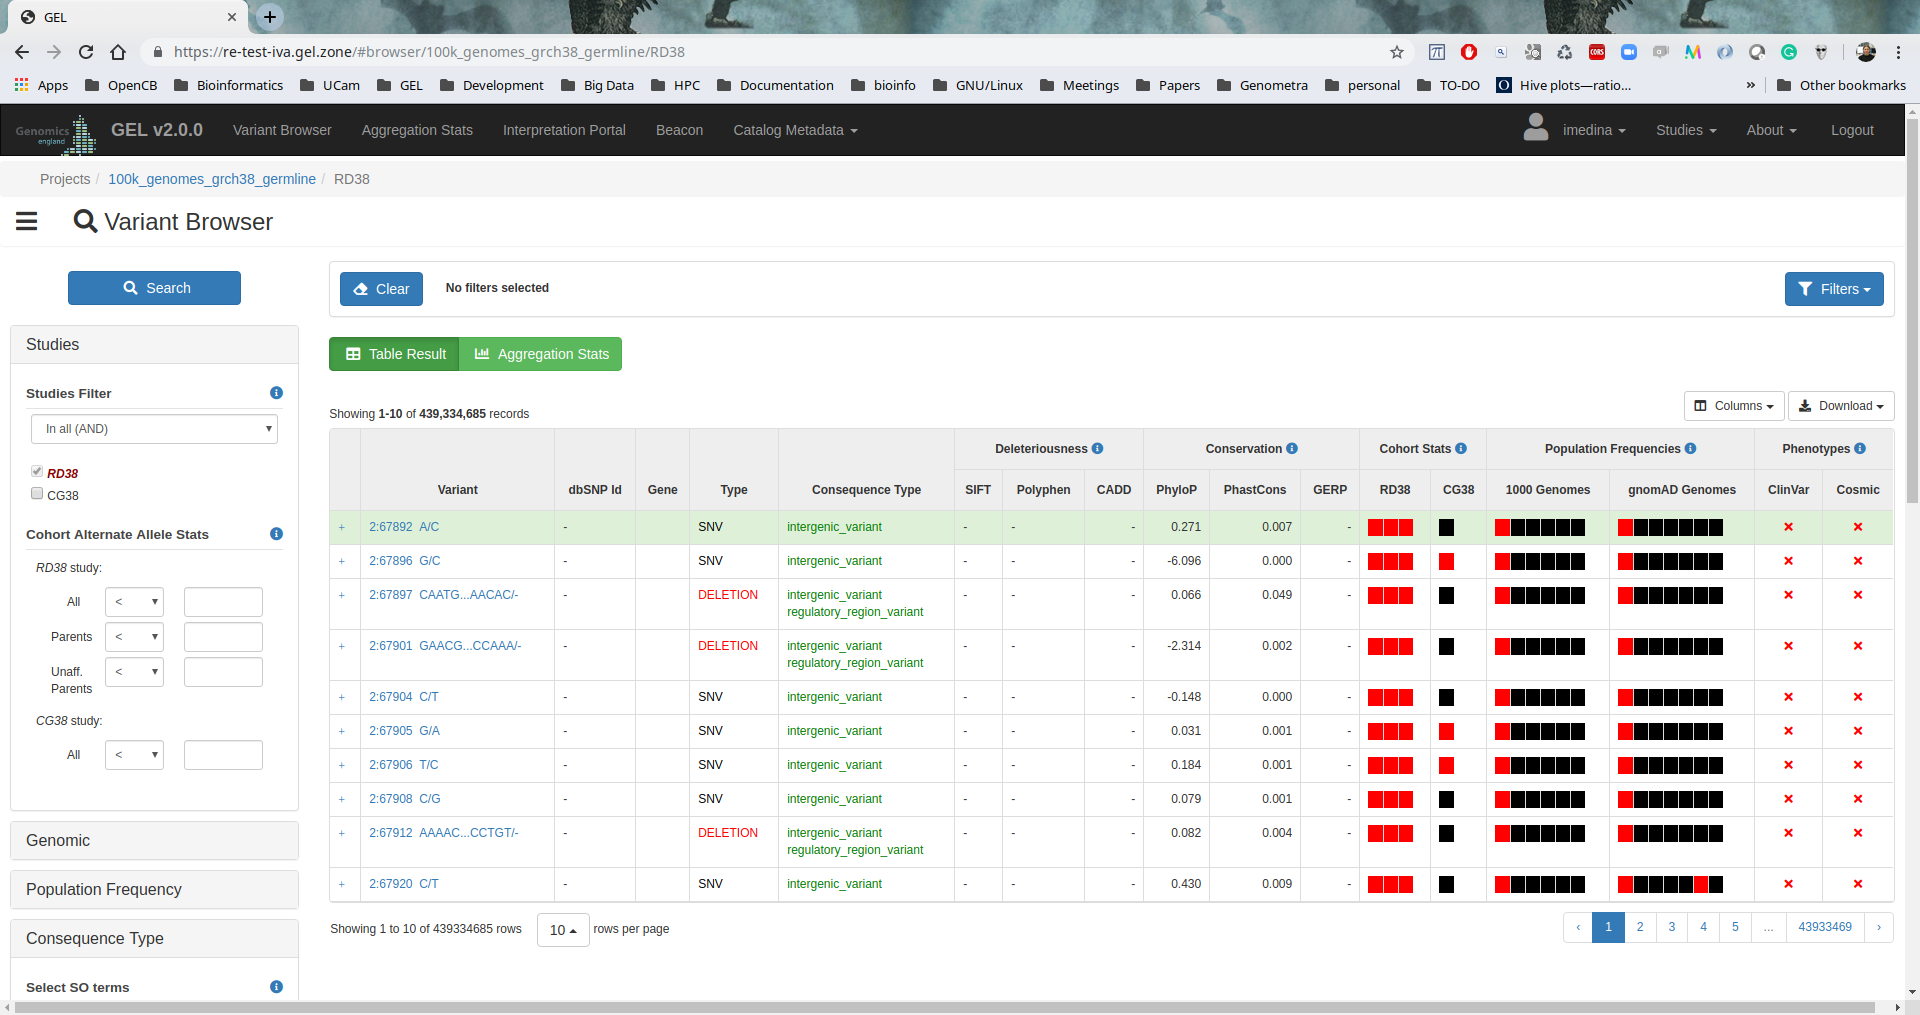
IVA v1.0.3 has been installed to provide a friendly web-based analysis tool to browse and perform aggregation stats over all the variants. Also, users can execute interactive clinical interpretation analysis or browse the clinical data.

Acknowledgements
We would like to thank Genomics England very much for their support and for trusting in OpenCGA and the rest of OpenCB suite Suite for this amazing release. In particular, we would like to thank Augusto Rendon, Anna Need, Carolyn Tregidgo, Frank Nankivell and Chris Odhams for their support, test and valuable feedback.
Table of Contents:
| Table of Contents | ||
|---|---|---|
|